
Architects around the world have been using 2D draughting tools on live projects for over 20 years. One of the most popular applications for design firms is Bentley Systems' MicroStation platform.
In recent years, KnowledgeSmart's online skills assessment software platform has captured test scores from thousands of Architects, representing hundreds of design firms, spread across six continents and a couple of dozen countries.
We have analysed the results data generated from these live assessments, at a basic skills level, and noted the following trends. For this particular study, the majority of our data is generated in the UK, USA, Australia and Canada (in that order).
A simple key to interpret the data below:
Architect = Job Title
MicroStation = MicroStation 2D skills
1 to 5 = 1 to 5 years' experience using the tool
6 to 10 = 6 to 10 years' experience using the tool
11 to 15 = 11 to 15 years' experience using the tool
Regular = use the tool daily (or almost daily)
Occasional = use the tool weekly (or less than weekly)
Self taught = learned to use the tool primarily 'on the job'
Formal = learned to the tool primarily via formal classroom or online training
All = overall KS benchmark data
AUS = Australia
CAN = Canada
UK = UK
USA = USA
Here is a summary of the results presented by different types of Architects.
Overall
MicroStation score overall: 59.3% in 5040 secs
Architect/MicroStation/1 to 5/regular/self taught/all = 53.8% in 5249 secs
Architect/MicroStation/1 to 5/regular/formal/all = 53.1% in 5131 secs
Architect/MicroStation/6 to 10/regular/self taught/all = 60.4% in 4974 secs
Architect/MicroStation/6 to 10/regular/formal/all = 59.9% in 4854 secs
Architect/MicroStation/11 to 15/regular/self taught/all = 59.7% in 4824 secs
Architect/MicroStation/11 to 15/regular/formal/all = 59.3% in 4754 secs
Architect/MicroStation/1 to 5/occasional/self taught/all = 49.5% in 5657 secs
Architect/MicroStation/1 to 5/occasional/formal/all = 48.8% in 5520 secs
Architect/MicroStation/6 to 10/occasional/self taught/all = 55.3% in 5309 secs
Architect/MicroStation/6 to 10/occasional/formal/all = 55.2% in 5267 secs
Architect/MicroStation/11 to 15/occasional/self taught/all = 55.8% in 5278 secs
Architect/MicroStation/11 to 15/occasional/formal/all = 55.1% in 5222 secs
Australia
MicroStation score Australia: 58.7% in 4873 secs
Architect/MicroStation/1 to 5/regular/self taught/AUS = 53.6% in 5201 secs
Architect/MicroStation/1 to 5/regular/formal/AUS = 53.0% in 5160 secs
Architect/MicroStation/6 to 10/regular/self taught/AUS = 59.2% in 4954 secs
Architect/MicroStation/6 to 10/regular/formal/AUS = 58.8% in 4889 secs
Architect/MicroStation/11 to 15/regular/self taught/AUS = 58.8% in 4876 secs
Architect/MicroStation/11 to 15/regular/formal/AUS = 58.2% in 4565 secs
Architect/MicroStation/1 to 5/occasional/self taught/AUS = 48.1% in 5595 secs
Architect/MicroStation/1 to 5/occasional/formal/AUS = 47.3% in 5476 secs
Architect/MicroStation/6 to 10/occasional/self taught/AUS = 54.9% in 5212 secs
Architect/MicroStation/6 to 10/occasional/formal/AUS = 54.2% in 5131 secs
Architect/MicroStation/11 to 15/occasional/self taught/AUS = 55.2% in 5152 secs
Architect/MicroStation/11 to 15/occasional/formal/AUS = 54.4% in 5059 secs
Canada
MicroStation score Canada: 57.7% in 5172 secs
Architect/MicroStation/1 to 5/regular/self taught/CAN = 52.7% in 5421 secs
Architect/MicroStation/1 to 5/regular/formal/CAN = 52.6% in 5387 secs
Architect/MicroStation/6 to 10/regular/self taught/CAN = 58.2% in 5178 secs
Architect/MicroStation/6 to 10/regular/formal/CAN = 57.8% in 5102 secs
Architect/MicroStation/11 to 15/regular/self taught/CAN = 58.3% in 5046 secs
Architect/MicroStation/11 to 15/regular/formal/CAN = 57.6% in 5012 secs
Architect/MicroStation/1 to 5/occasional/self taught/CAN = 47.4% in 5754 secs
Architect/MicroStation/1 to 5/occasional/formal/CAN = 46.8% in 5632 secs
Architect/MicroStation/6 to 10/occasional/self taught/CAN = 54.6% in 5512 secs
Architect/MicroStation/6 to 10/occasional/formal/CAN = 53.8% in 5466 secs
Architect/MicroStation/11 to 15/occasional/self taught/CAN = 55.1% in 5432 secs
Architect/MicroStation/11 to 15/occasional/formal/CAN = 54.7% in 5313 secs
UK
MicroStation score UK: 61.3% in 4859 secs
Architect/MicroStation/1 to 5/regular/self taught/UK = 55.5% in 5285 secs
Architect/MicroStation/1 to 5/regular/formal/UK = 55.1% in 5222 secs
Architect/MicroStation/6 to 10/regular/self taught/UK = 61.5% in 4862 secs
Architect/MicroStation/6 to 10/regular/formal/UK = 61.1% in 4828 secs
Architect/MicroStation/11 to 15/regular/self taught/UK = 61.3% in 4901 secs
Architect/MicroStation/11 to 15/regular/formal/UK = 60.8% in 4788 secs
Architect/MicroStation/1 to 5/occasional/self taught/UK = 49.7% in 5456 secs
Architect/MicroStation/1 to 5/occasional/formal/UK = 49.1% in 5402 secs
Architect/MicroStation/6 to 10/occasional/self taught/UK = 56.3% in 5232 secs
Architect/MicroStation/6 to 10/occasional/formal/UK = 55.6% in 5179 secs
Architect/MicroStation/11 to 15/occasional/self taught/UK = 56.7% in 5143 secs
Architect/MicroStation/11 to 15/occasional/formal/UK = 55.8% in 5056 secs
USA
MicroStation score USA: 59.2% in 5374 secs
Architect/MicroStation/1 to 5/regular/self taught/US = 54.2% in 5767 secs
Architect/MicroStation/1 to 5/regular/formal/US = 53.6% in 5647 secs
Architect/MicroStation/6 to 10/regular/self taught/US = 59.6% in 5387 secs
Architect/MicroStation/6 to 10/regular/formal/US = 59.2 in 5322 secs
Architect/MicroStation/11 to 15/regular/self taught/US = 59.5% in 5278 secs
Architect/MicroStation/11 to 15/regular/formal/US = 59.2% in 5166 secs
Architect/MicroStation/1 to 5/occasional/self taught/US = 48.4% in 5767 secs
Architect/MicroStation/1 to 5/occasional/formal/US = 47.7% in 5665 secs
Architect/MicroStation/6 to 10/occasional/self taught/US = 55.1% in 5489 secs
Architect/MicroStation/6 to 10/occasional/formal/US = 54.8% in 5447 secs
Architect/MicroStation/11 to 15/occasional/self taught/US = 55.6% in 5420 secs
Architect/MicroStation/11 to 15/occasional/formal/US = 55.1% in 5391 secs
Observations
All four territories in this study are mature markets, in terms of MicroStation adoption.
Each country is an established Bentley Systems' market, with a high quality learning and development environment and vendor consultancy support.
Each country is well supported by professional bodies, AEC industry conferences and established vendor user community groups and online resources.
Overall, regular users are more accurate and faster than part-time users.
Architects with 6 to 10 years' of experience with these tools are the most efficient. They reach a plateau in performance after c. 7 years and make no further productivity gains.
Architects who learn to apply these tools on projects are more accurate than those who have primarily formal training, but less practical experience. Formally trained users are faster overall than self-taught users.
R
Showing posts with label CAD training. Show all posts
Showing posts with label CAD training. Show all posts
Saturday, 27 February 2016

Friday, 1 April 2011
8 Steps to More Effective Training Needs Analysis
OK, so you've captured a range of test scores in your firm. What next? The KnowledgeSmart dashboard offers you a number of options for reporting on your firm's results and identifying skills gaps across your teams.
Here are some steps you can take to interpret your test data..
Step one
Use the searching tools in the 'Results' page of your dashboard, to filter your raw test data. You have a range of search parameters available. For example, min score, max score, elapsed time, user name, test name & ID, date ranges, training meta tags, plus 5 extra datafields for categories of your own choosing.

You can use the 'List all training tags' tool, in the 'Your Tests' page of your dashboard, to export a master list of training workshop topics, for each test in your library. You can then search on these keywords, to identify users who require training on each category.

Step two
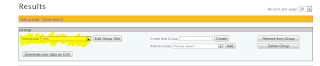
When you have run your search, create a new sub-group of your data, using the grouping tools. For example, all users who scored 60% or less on basic AutoCAD; all users who took longer than 90 mins to complete a basic MicroStation test; all users who require training on worksets in Revit Architecture; all users in your Kansas City office who scored 80%+ on Adobe Photoshop, and so on.
Step three
Use the charting tools to create management reports for each group and highlight priority training issues. The Training Requirements chart gives you an easy at-a-glance way of identifying the most urgent training topics, for a given group of users.

The Question Performance chart helps you to monitor question scores for each test in your library and further recognise any potential problem areas. Use the export to PDF tools to create hard copies of your charts.

Step four
Use the Group Comparison charts to analyze and compare results across a range of search results. For example, the same group of users, pre-and-post training (to measure performance improvement); multi-office results comparison; interview scores vs employee scores, and so on.

The Global Comparison chart offers you an external benchmark, for our most popular test titles.

Step five
You also have the option to export your results data to csv. When you export results, you will see on the right hand side of the sheet, a field called, 'Training Tags'. This is a personal summary of training topics for each user, representing keywords relating to questions where, for whatever reason, they didn't score 100% on the question.


Step six
It's a good idea to schedule a brief one-to-one sit down with your users, to discuss their test results and training recommendations summary. Disregard tags relating to questions where they made a silly mistake, or misread the instructions, etc. What you are left with is a list of training workshop topics that you - and they - both agree represent genuine skills gaps for a given software topic.

Step seven
Follow up with modular training workshops, which specifically target the highlighted skills gaps. If possible, try to group people together according to experience and ability. For example, avoid training novice users and expert users in the same session. You can use the KS meta tags to link to corresponding modular learning content from third parties (i.e. Evolve Consultancy, White Frog, 4D, Bentley Learn, ATC's, etc.) and your own in-house training collateral.
Step eight
Identify your most experienced users for the most significant software titles used by your firm. They will typically be the people appearing in Quartile 1 or Quartile 2 on your Performance Spread charts, or the people featuring in the top third of your Group Scores charts.


Challenge your leaders to help create bite-sized, modular training material, which you can then use to share knowledge and best practice across the firm. This is an effective way to turn 'tacit' knowledge (i.e. the information locked away in people's heads), into 'explicit' knowledge (i.e. documented, searchable and accessible to your organisation). Tag your learning material, so it can be searched and easily found via your firm's intranet, LMS, or similar.
Using the KS tools in this way, you can identify both problem areas and examples of excellence and best practice, across your firm. And target the main productivity issues with focused, relevant training and learning resources.
R
Here are some steps you can take to interpret your test data..
Step one
Use the searching tools in the 'Results' page of your dashboard, to filter your raw test data. You have a range of search parameters available. For example, min score, max score, elapsed time, user name, test name & ID, date ranges, training meta tags, plus 5 extra datafields for categories of your own choosing.

You can use the 'List all training tags' tool, in the 'Your Tests' page of your dashboard, to export a master list of training workshop topics, for each test in your library. You can then search on these keywords, to identify users who require training on each category.

Step two
When you have run your search, create a new sub-group of your data, using the grouping tools. For example, all users who scored 60% or less on basic AutoCAD; all users who took longer than 90 mins to complete a basic MicroStation test; all users who require training on worksets in Revit Architecture; all users in your Kansas City office who scored 80%+ on Adobe Photoshop, and so on.

Step three
Use the charting tools to create management reports for each group and highlight priority training issues. The Training Requirements chart gives you an easy at-a-glance way of identifying the most urgent training topics, for a given group of users.

The Question Performance chart helps you to monitor question scores for each test in your library and further recognise any potential problem areas. Use the export to PDF tools to create hard copies of your charts.

Step four
Use the Group Comparison charts to analyze and compare results across a range of search results. For example, the same group of users, pre-and-post training (to measure performance improvement); multi-office results comparison; interview scores vs employee scores, and so on.

The Global Comparison chart offers you an external benchmark, for our most popular test titles.

Step five
You also have the option to export your results data to csv. When you export results, you will see on the right hand side of the sheet, a field called, 'Training Tags'. This is a personal summary of training topics for each user, representing keywords relating to questions where, for whatever reason, they didn't score 100% on the question.


Step six
It's a good idea to schedule a brief one-to-one sit down with your users, to discuss their test results and training recommendations summary. Disregard tags relating to questions where they made a silly mistake, or misread the instructions, etc. What you are left with is a list of training workshop topics that you - and they - both agree represent genuine skills gaps for a given software topic.

Step seven
Follow up with modular training workshops, which specifically target the highlighted skills gaps. If possible, try to group people together according to experience and ability. For example, avoid training novice users and expert users in the same session. You can use the KS meta tags to link to corresponding modular learning content from third parties (i.e. Evolve Consultancy, White Frog, 4D, Bentley Learn, ATC's, etc.) and your own in-house training collateral.
Step eight
Identify your most experienced users for the most significant software titles used by your firm. They will typically be the people appearing in Quartile 1 or Quartile 2 on your Performance Spread charts, or the people featuring in the top third of your Group Scores charts.


Challenge your leaders to help create bite-sized, modular training material, which you can then use to share knowledge and best practice across the firm. This is an effective way to turn 'tacit' knowledge (i.e. the information locked away in people's heads), into 'explicit' knowledge (i.e. documented, searchable and accessible to your organisation). Tag your learning material, so it can be searched and easily found via your firm's intranet, LMS, or similar.
Using the KS tools in this way, you can identify both problem areas and examples of excellence and best practice, across your firm. And target the main productivity issues with focused, relevant training and learning resources.
R
Thursday, 19 August 2010
540,000 hours
I was chatting to one of our large AEC customers last week. They have about 1,000 CAD, BIM & Engineering software users around the group. During our chat, we discussed the fact that they are putting together a business case for management, aimed at securing additional budgets for investing in new training & learning tools. As part of this process, they worked out that they spend approx. 540,000 man (or woman) hours EACH YEAR, producing CAD drawings. And that's just in the UK, which is only part of the wider group!
I don't know what their hourly charge-out rates are, but let's say, for argument's sake, that the figure is £100/hr. That's a cool £54M per year on CAD production alone.
Now let's picture the impact of a 2% improvement in productivity across the year - that's over £1M in savings, or half a million quid for every 1% increase!
Suddenly, spending a few grand on testing and training tools starts to make a lot of business sense!
Let's look at some more numbers;
Take an average salary of £25k p.a. and a 225 day working year.
For every 1% improvement in productivity, a practice will save £250 or 2.25 days per person per year. Targeting a 5% annual improvement in performance, this is worth £1,250 or 11.25 days per person per year. (11.25 days = 90 working hours (average 8 hour work day)).
For a firm with 20 staff, this is worth the equivalent of a new member of staff! (20 x £1,250 = £25,000).
Now let's look at hiring; how much does it cost to employ inappropriate personnel for 3 months?
Assuming a £25k annual salary:
15% agency fee = £3,750
3 months’ salary = £6,250
Assuming £18/hr:
7.5 hrs x 5 days = £675 x 12 weeks = £8,100
These examples don’t include advertising costs for staff employed direct, or the cost of re-working for drawings which weren’t done right first time.
R
Thursday, 5 August 2010
Daisy-chain

This month, we are introducing a change to the way assessments are authored, based on the idea of linking separate modules in a 'daisy-chain', to create a longer test.
In essence, the KS system breaks down like this;
- A test is one or more modules linked together.
- A module is comprised of typically 4-6 questions, covering the same topic, i.e. Families in Revit or UCS in AutoCAD, etc.
- A question tests an individual's understanding of a particular software feature or command.
Questions and modules have training tag keywords (meta tags) associated with them, which makes training needs analysis, post-assessment, much more relevant.
Questions can be "task" based or "knowledge" based.
A task based question has files associated with it. The user has to do something to the file, in order to work out the answer, as follows;
- Task (interrogate) - the user has to open the file and find the answer, but they don't have to modify or change the file in any way.
- Task (modify) - the user has to open and modify the file, to work out the correct answer.
- Knowledge - this type of question does not require a file to be associated with it.
Test administrators can present a single module as a test, provided they create a new test from the module first.
A 'daisy-chain' happens when an administrator links a series of modules together, to create a longer test.
This concept allows us to create a wide range of test material, in bite-sized blocks, which map closely to corresponding training and learning material.
Daisy-chains go live next month.
R
Wednesday, 20 January 2010
CAD & BIM - State of the Nation(s) article
Happy New Year. Towards the end of last year we held a series of (taped) discussions with the guys at Evolve (http://www.evolve-consultancy.com) and Robert Green (http://www.cad-manager.com) , which culminated in a published article looking at the big picture of CAD training, CAD management, BIM, and a whole lot more.
Credit to Karen for her amazing editing skills and to Nigel for making a fair dent in his red wine collection, as the evenings wore on! :)
The results were published in a variety of places, but most recently, here: http://www.itshowcase.co.uk/News/2009-05-12/Is-your-business-smart-enough-An-interview-on-CAD-usage/.
So, we're finally out of 2009 (hooray!). 2010 is looking much more encouraging, with the economy starting to drag itself off the floor. 'Bout time!
February sees the rollout of the new KnowledgeSmart web-based testing tools. If you'd like a demo, drop a line to info@knowledgesmart.net, with 'DEMO' in the subject line, and we'll pencil you in.
Plenty more to follow over the coming weeks..
Rory
Credit to Karen for her amazing editing skills and to Nigel for making a fair dent in his red wine collection, as the evenings wore on! :)
The results were published in a variety of places, but most recently, here: http://www.itshowcase.co.uk/News/2009-05-12/Is-your-business-smart-enough-An-interview-on-CAD-usage/.
So, we're finally out of 2009 (hooray!). 2010 is looking much more encouraging, with the economy starting to drag itself off the floor. 'Bout time!
February sees the rollout of the new KnowledgeSmart web-based testing tools. If you'd like a demo, drop a line to info@knowledgesmart.net, with 'DEMO' in the subject line, and we'll pencil you in.
Plenty more to follow over the coming weeks..
Rory
Subscribe to:
Posts (Atom)

 Posts
Posts

