Showing posts with label Filter. Show all posts

Tuesday, 29 January 2019

Collaborate With Confidence - Build Your Updated Skills Inventory in 2019


If we are going to see improvement in project collaboration all stakeholders will need to start interacting much earlier on. 

Collaborating using Autodesk Revit software for example requires a specific skillset e.g. interference checking, model linking, working with worksets, understanding the copy/monitor tool and more.

Within a couple of minutes, KnowledgeSmart administrators can build an assessment in KnowledgeSmart focusing around assessing their team on these specific aspects. 

Having access to up to date skills inventories across all participating companies can help build a successful team that is adept at working together. It can also help assess suitability for collaboration and where collaboration should take place ideally. 

One of the biggest costs of projects is waste and I am not just referring to physical waste. Wasted resources and poor resource planning can cost companies millions.

KnowledgeSmart Results Analysis - Collaboration

The above image shows the results from two firms looking to collaborate. Visual slicers on the right include: company name, certificated training (yes or no), 2Yrs+ Project Experience (Yes/No), Current Project Focus, Project Manager, Elapsed Time and Hire Date. We can assess collaboration suitability and even map out optimal project teams.


KnowledgeSmart Radial Chart - Skill Gap Analysis


The above visualisation uses a radar chart to compare the skills gaps across two companies. The process involves focusing on the skills that the project needs. If the skill gaps are too considerable for training to solve, at this point, the project management team would consider collaborating with a further company or hiring internally focussing on the relevant skills required. Using the 5 unique datafields that KnowledgeSmart allows you to capture our analysis contains richer data. In this case: office location, hire date, project area focus, years of project experience and certificated training (yes or no).

KnowledgeSmart Skill Gap Analysis - Collaboration

The above image shows a slightly different way of looking at skill gaps across the collaborating companies and these can be analysed according to current team structure or even on an individual bases.

KnowledgeSmart Project Mentors - Collaboration

Using the same filters as described above we can now also identify the best possible project mentors between the two companies. Who are the people that can offer the most support to teams on either side of the collaboration? 

KnowledgeSmart Microsoft PowerBI Dashboard Focusing on Collaboration

 All these visualisations can easily be added to a dashboard that can be shared across the management team and stakeholders so that improved, more insightful decisions can be made very early on.

KnowledgeSmart can help companies collaborate with more confidence both internally and externally. This will identify potential risks and problems early on and make sure the right people are assigned to the right elements of the right project.

 

Sunday, 17 January 2016

KS New Release - Data Query Tool

The KS admin dashboard has a new element this month... a new query builder and reporting tool. The release is part one of three, for this tool.

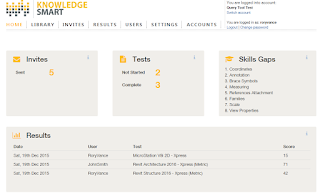
When you log in to your dashboard as a KS admin, you will now see a new landing page, called 'HOME'.

The top half of the page displays 4 sections, which summarize some useful at-a-glance data, as follows:

Number of Invites sent in last 30 days
Number of Tests in last 30 days (Not Started, In Progress and Complete)
Top 8 Skills Gaps (based on results from last 6 months' results)
Results (last 5 completed tests)


At the bottom of the page, you will find the new query tool. This includes a range of 'pre-defined' queries, as follows:

50% or less test scores
70% or greater test scores
All invites from last 30 days
All results from last 30 days
Incomplete invites from last 30 days
All employee scores
All interviewee scores
All expired invites


You can edit pre-defined copies by first taking a copy, then editing the copy and saving with a different name.

Create new queries by clicking on the 'Create New Query' button.
Edit queries by clicking on the 'Edit Query' button.
Copy existing (or pre-defined) queries by clicking on the 'Copy Query' button.
Delete queries by clicking on the 'Delete Query' button.


Run queries across all linked accounts, or selected child accounts, by checking the relevant boxes in the 'Run Against Accounts' area:


When you create a new query, you will see this box appear:


There are 4 main sections which can be presented in your report: 
Users - this captures data about the user profile and account where the user record is stored
Background - this captures data about user demographics info
Invites - this captures data about invite (and related test) status
Results - this captures data about results (and related test) status

Click 'Display these columns' to expand the top section. Use the check boxes to build up the columns of your data query. The columns selected here will also be presented in your csv export. Click on the '+' icon, if you want to add this element to your filter options in the 'match ALL conditions' section below.  

In the query conditions section below, use the filter on the left of the screen to toggle between the following search topics: Users, Background, Invites, Results.


Queries can be a combination of 'ALL of these conditions' only, or 'ANY of these conditions' only, or both.


Use the dropdowns to build up the logic of your queries. There are lots of different options available, so you can filter your user, invites and results data in lots of new ways.

Export queries to csv for further analysis, by clicking on the 'Download' button.


This release is part one of three. Here's what we're working on next.

Part Two

Allow KS admins to perform a series of bulk actions, with the results of a query.  

For example:

Delete users
Move users from one account to another
Invite users to a test
Delete results
Move results from one account to another
Delete invites
Change invite expiry date
Re-send invites

We'll also add individual training tags to the search options, allowing you to create workshop groups for users who have common skills gaps.


Part Three

Graphics & charts: we plan to display a range of visual summary fields on the dashboard landing page.

For example:

No. of invites sent in last x days
No. of completed tests in last x days
No. of incomplete tests in last x days
Users who have 'incomplete tests' 
Most popular test topics by number taken
Average score and time for top 5 test topics
Average score for Employees vs Interviewees
Global benchmark comparison for top 5 test topics
Last x results: user names, test names, scores & times
Top 20 skills gaps (i.e. training tags)
Top 20 hardest test questions (i.e. lowest scoring average)


We will also include the ability to send auto-email reports to KS admins, which contain custom values and timescales.

As always, we welcome your feedback and ideas, so if you have any additional feature requests, in the context of searching, filtering, grouping and reporting data, we'd love to hear them!

R